

초정밀 위상 측정장치로서 신재생 마이크로그리드에서 말단과 변전소간의 위상을 측정하는 장치

Monitoring distribution grids and micro-grids with microPMU’s
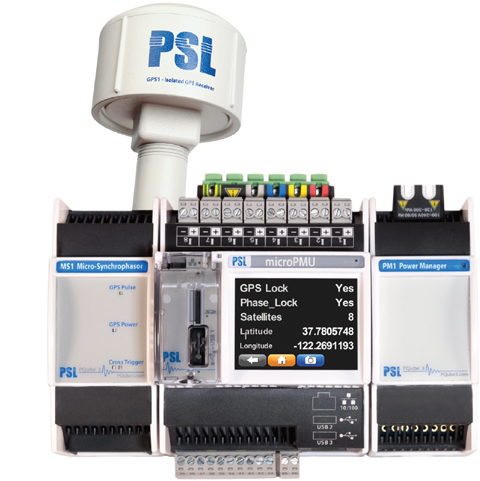
Synchrophasors (also called PMU’s) measure the angle between voltages and currents, at different physical locations on a grid. Traditionally, synchrophasors have been used to investigate the stability of transmission grids. Distribution grids have much tinier angle differences – too small, and changing too rapidly, to resolve with traditional transmission-type Phasor Measurement Units (PMU’s). The U.S. Department of Energy’s Advanced Research Project Agency (ARPA-E) funded a US$4 million project to develop the most precise synchrophasor instrument ever made, with 100 times the resolution of traditional transmissiontype PMU’s: 0.001° and 2PPM! The microPMU is ideal for research projects that need ultra-precise synchrophasor measurements for investigating stability and impedance questions on distribution grids and microgrids. Note: The microPMU is a research-grade instrument. The specifications link below is given for guidance in developing your research project. http://www.powersensorsltd.com/Download/MicroPMU%20%20Data%20Sheet%20Rev2.pdf. Please contact Power Sensors Ltd to discuss your planned research project with an experienced distribution grid MicroPMU engineer.

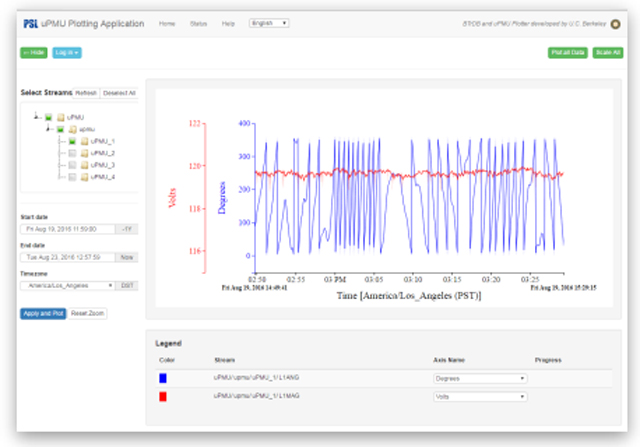
Microsynchrophasors measurement is a new technology. It involves continuous monitoring and recording of phenomena on the distribution or microgrids. The microPMU Plotting Application software has been developed specifically to assist researchers and engineers manage and navigate through the large amount of measurements generated by the microPMU’s. The quick start kit as a convenient way to start a measurement campaign in just a few hours. It includes instruments, cables, connectors, software and a basic communication infrastructure: all is provided in a single pack to give you a head start! The start kit contains:
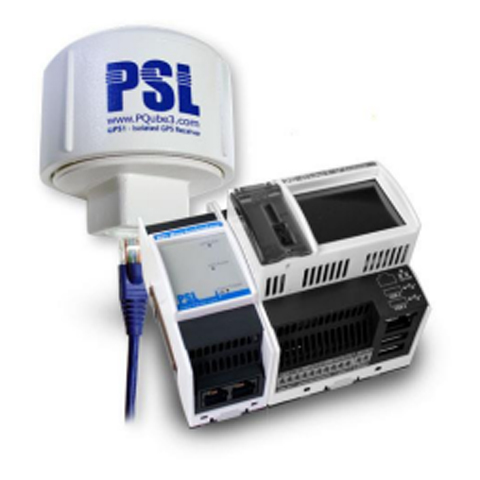
4 microPMU’s (DINRail mounted), pre-configured and ready to measure single or 3 phase voltages and currents with snap –on current transformers. Each microPMU has 16GB of internal memory, is factory calibrated, certified and comes with an isolated GPS receiver.
One powerful Dell server, comes pre-installed with Linux and the Plotting Application software. The server has a storage capacity of 2TB and supports up to 10 microPMU’s.
A 16 port Ethernet switch
All power and network cables ready for use.
First steps and administrator manual

Practical example of information that can only be seen with microPMU’s : a small current surge (in red) at Lawrence Berkeley National Lab lowers the voltage (violet) at PSL, more than 10 miles away. microPMU’s precise time synchronization and ultra-high resolution are necessary to identify these kinds of correlations in a distribution grid
Beyond the classic voltage and current synchrophasors, microPMU’s also compute and record onboard the following parameters: frequency, fundamental apparent, active and reactive powers as well as DPF (displacement power factor) at a rate of 120 samples per second. Each microPMU is preconfigured to start sending synchrophasor measurements to the server (via the Ethernet network), as soon as it gets GPS signal and is phase-locked. The Plotting Application software is open source, and runs on the server. The application can be accessed from a PC via an Internet browser. The software allows to manage the fleet of microPMU’s and its measurement parameters. Displaying, selecting, zooming, browsing is instantaneous thanks to the specific database engine specifically developed for this purpose by UC Berkeley. When researchers spot interesting phenomena, they can export the measurement data set to files or can create and share permanent internet links, with other researchers at different locations.

Practical example of information that can only be seen with microPMU’s : a small current surge (in red) at Lawrence Berkeley National Lab lowers the voltage (violet) at PSL, more than 10 miles away. microPMU’s precise time synchronization and ultra-high resolution are necessary to identify these kinds of correlations in a distribution grid
우석 대학교